Audience Overlap & Ads Data Hub: Designing a distinctive audience architecture
Overlap between publishers and an advertiser’s media buys
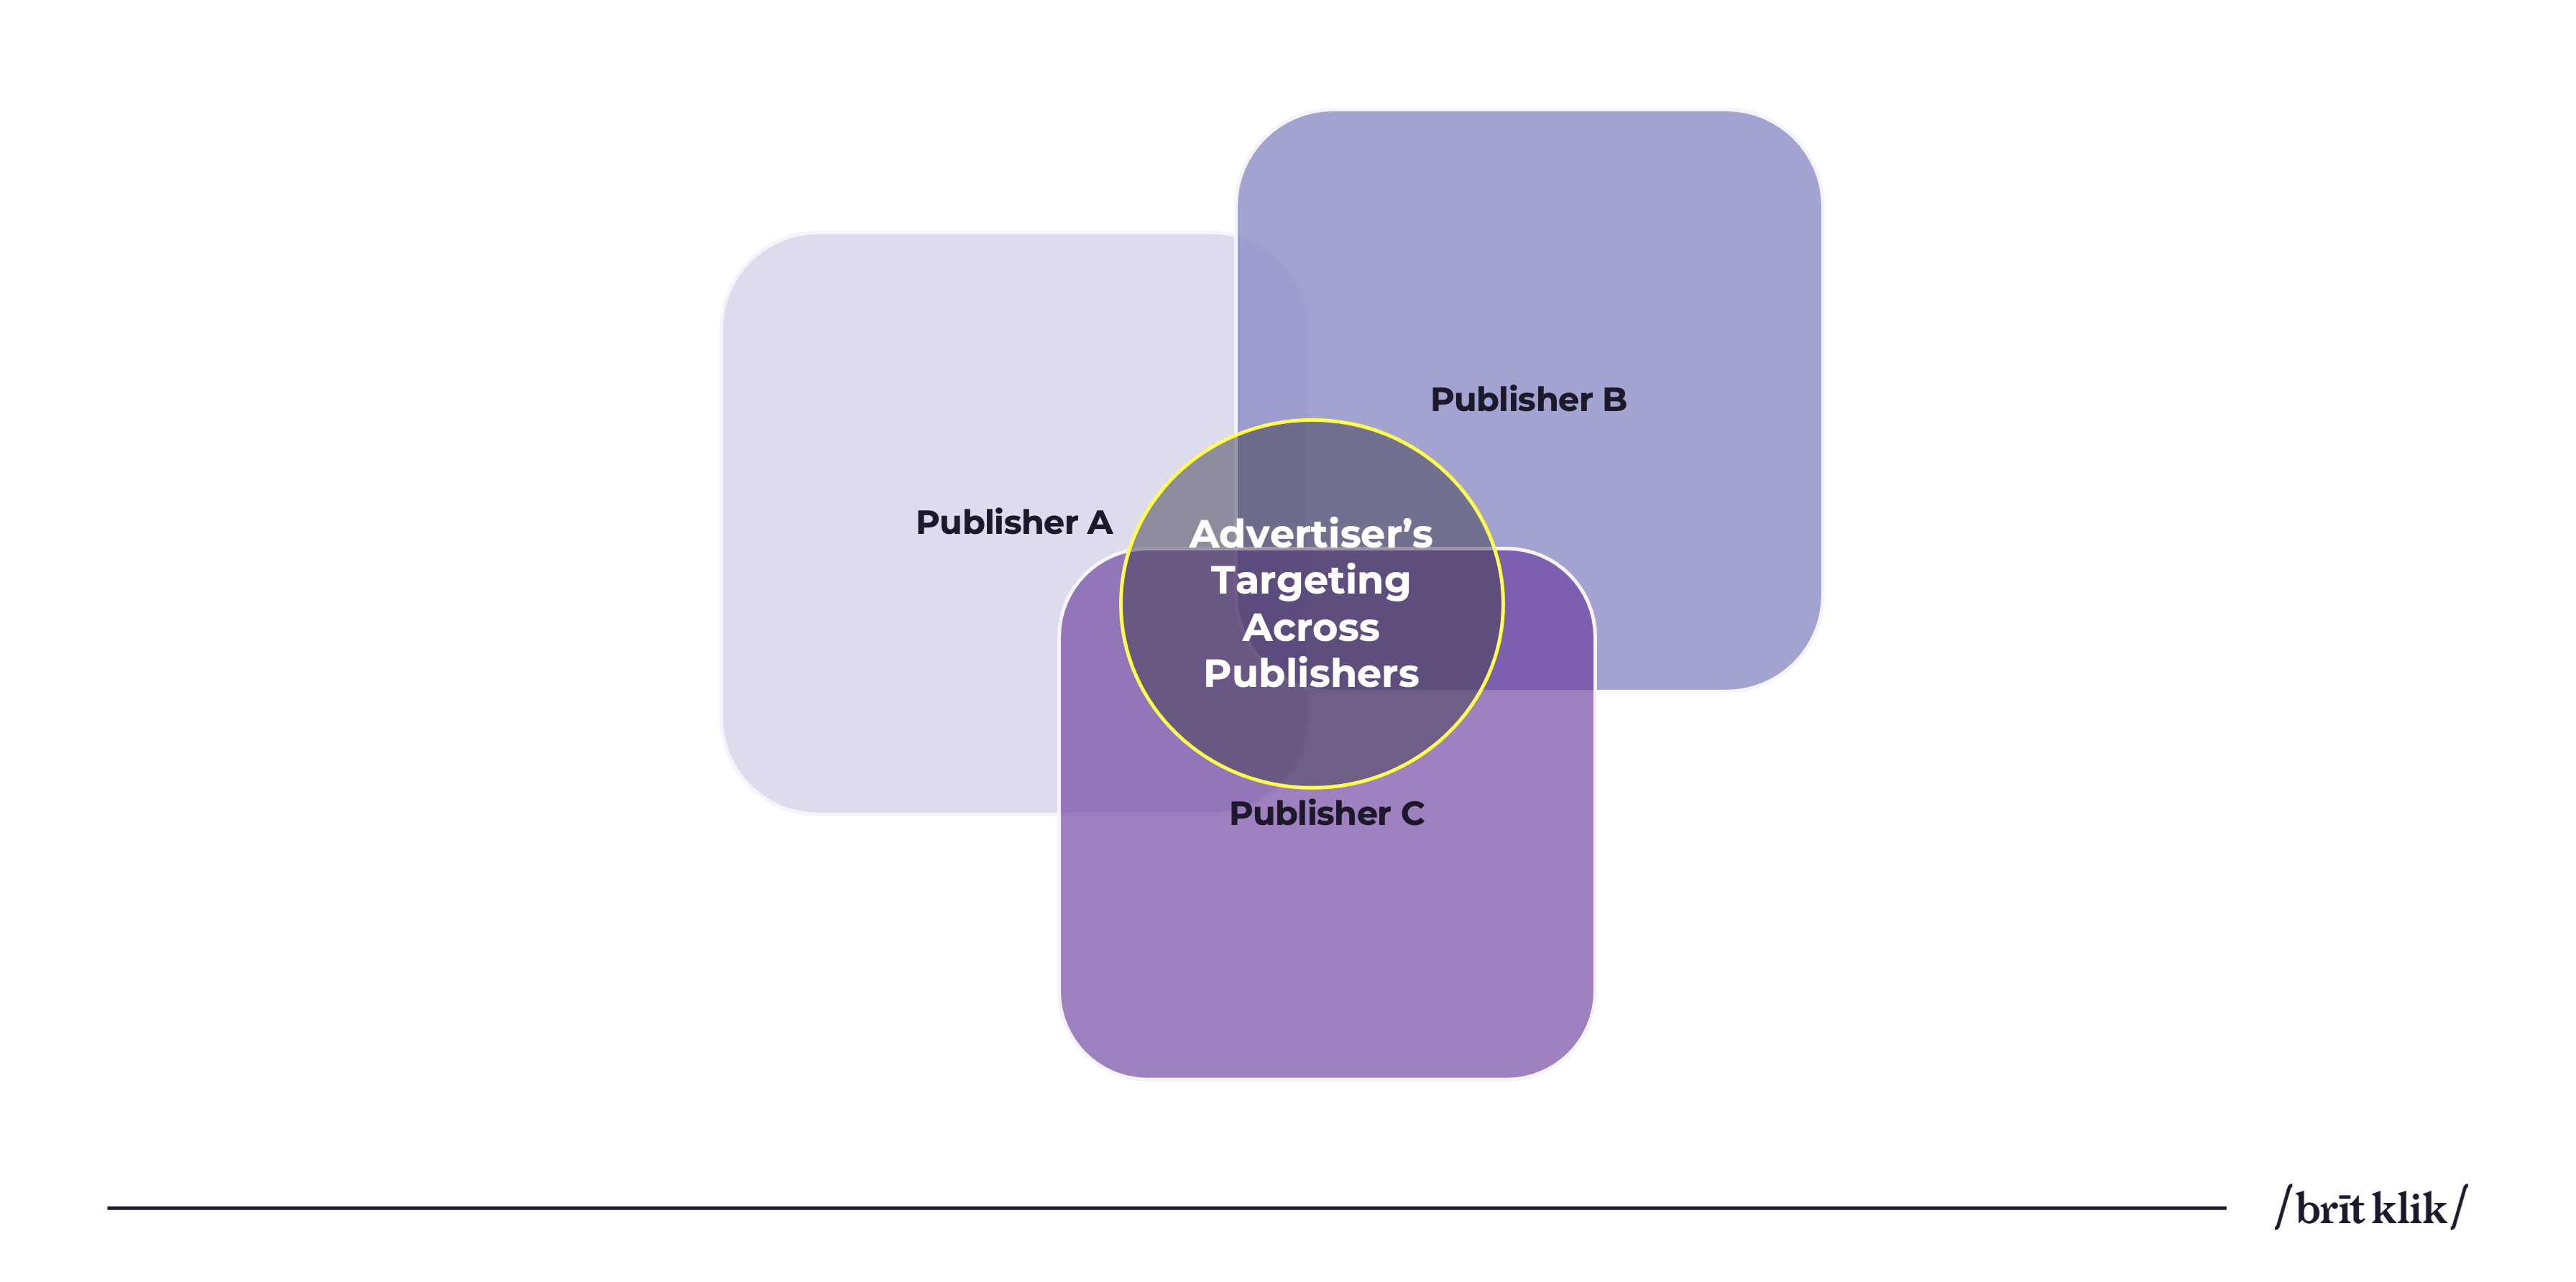
Let’s face it — measuring how well brand advertising works is tough. Making the most of your budget for raising awareness is even tougher. In the world of branding, putting more money into what’s already successful often brings exponential diminishing returns. One big reason for this downside is the overlap in audiences across different publishers.
As discussed in the previous article of this series, the ability to identify and connect with unique users forms the bedrock of upper-funnel media strategies. An advanced analysis of the overlap within an advertiser’s targeting becomes the driving force behind a distinctive media architecture, ultimately boosting return on investment.
Based on Google’s literature, here is how they sell it:
“When users see your ads on multiple sites, it’s called overlap. If your campaign goal is to build brand awareness, you could share your message to your users across all targeted sites, day after day. If you want to maximize your audience reach, you could reduce the amount of overlap between sites. With overlap reports, you can make informed decisions on how best to maximize your media spend across multiple sites.”
However, executing this strategy is easier said than done.
Where to start in Display & Video 360
Before diving into audience overlap, a Unique Reach report usually serves as starting point that will spark conversations about overlap. Unique Reach measures users that interacted with an advertiser’s ads across different environments and devices. In this case, let’s pull some real-life data to get a high-level idea of reach & frequency metrics from the advertiser’s media investment across publishers A, B and C.
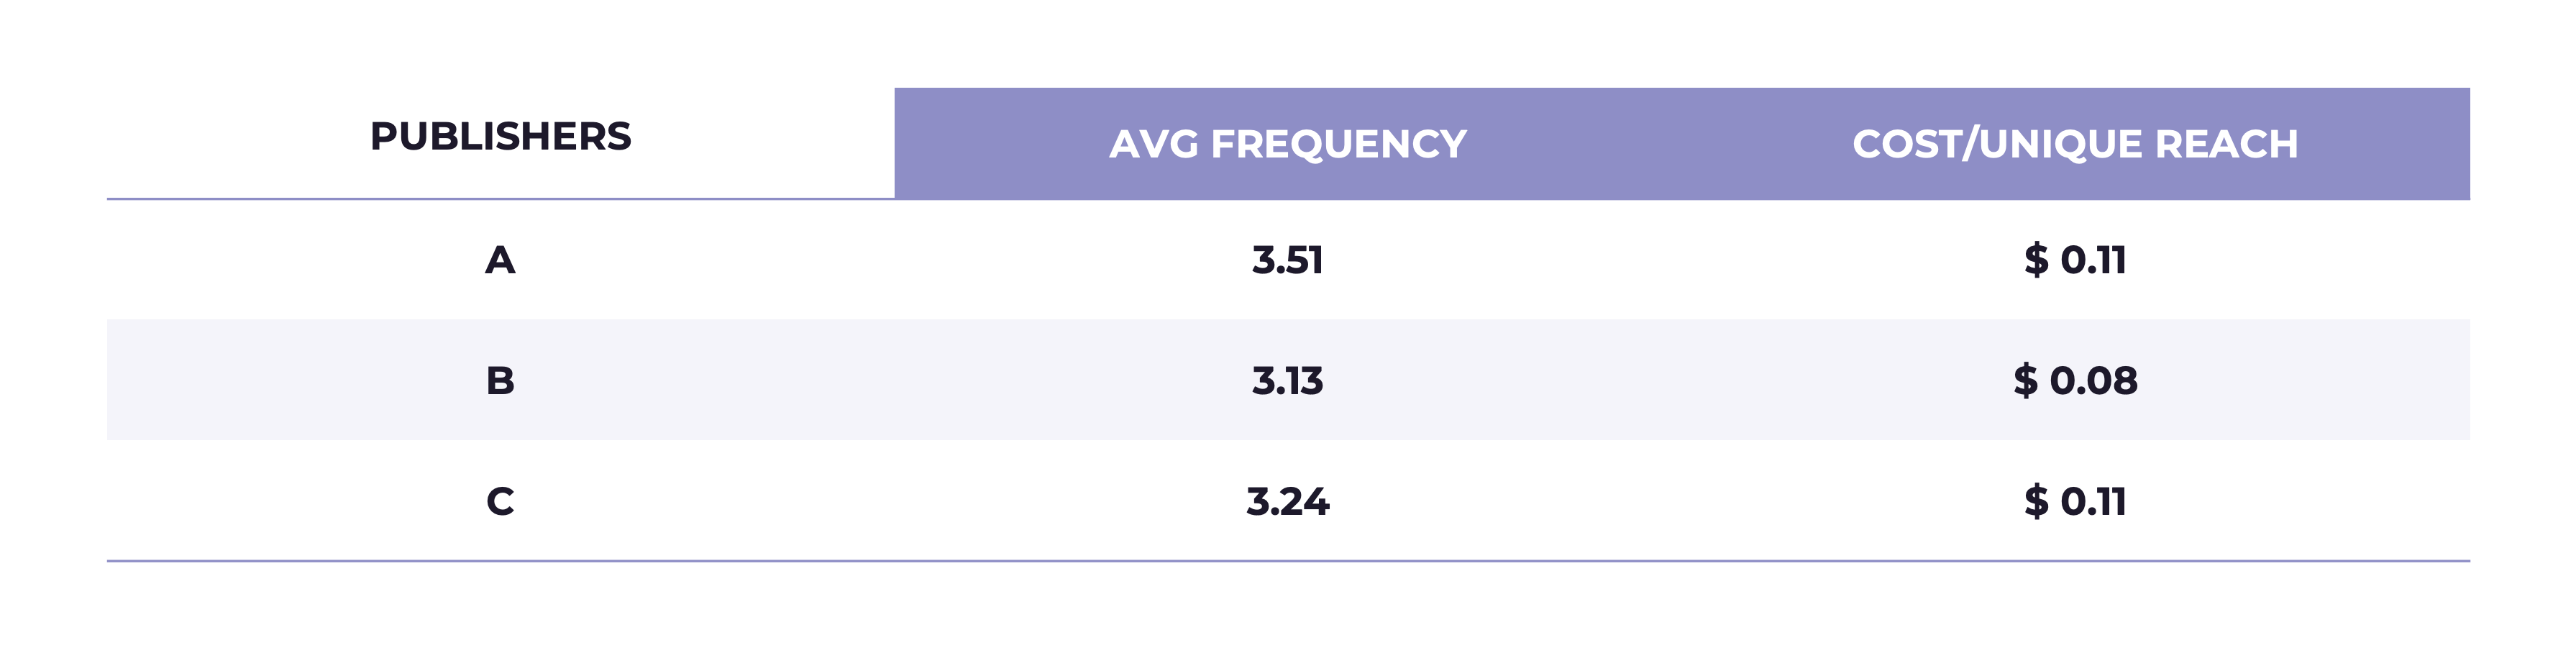
Prior to analyzing cost efficiencies around reach across publishers, you may want to take a peek at the Average Frequency. This metric tells you, on average, how many times unique users saw your message over a certain time. If this number varies a lot between publishers, comparing them on an equal footing becomes tricky because as it also affects the Cost per Unique Reach. Simply put, for audience fatigue reasons, the higher the Average Frequency, the pricier it becomes to reach a new Unique User, and vice versa.
How DV360 is navigating reach and frequency management in the post-cookie era
Nowadays, a big question on everyone’s mind is whether we can really trust the results of such reports. It all boils down to how well the tech (like Google, in this case) can connect the dots for unique users across various publishers, devices, operating systems and browsers.
As we all know, user-level data in 2024 isn’t flawless. It’s more of a proxy than an absolute truth. To measure challenging environments such as IOS/Safari, DV360 uses advanced probabilistic methods to fill in the blanks and is fully transparent about it. If you have a desire to understand the depth of the guess work, you can pull a standard report with a dimension called ‘anonymous inventory modelling’. It will inform you on the percentage of deterministic vs probabilistic impressions Google leveraged to enhance the management of reach and frequency.

Looking at the data, we notice that deterministic measurement for publishers B and C represents most of the impressions served. However, for Publisher A, it contributes to half of the data. It’s essential to highlight that if the percentage gap between these publishers is too wide it weakens the strength of the comparison as well.
What truly matters here is that Google, by using its logged-in environment data, device IDs, cookies, and statistics, has expertly put together a solid representation of reality. This not only helps in the current analysis but also lays the groundwork for making well-informed decisions in the future.
What you can already do around overlap just with DV360
The key data point from the initial table that might grab the attention of an advertiser looking to expand their campaign setup is the Cost per Unique Reach for Publisher B, $ 0.08. This raises the question: If we allocate more budget to only Publisher B, will it be the most effective method to reach previously untouched users with our advertising message? To address this query, an advertiser can pull an Audience Overlap report from DV360.

Where Ads Data Hub enters the conversation
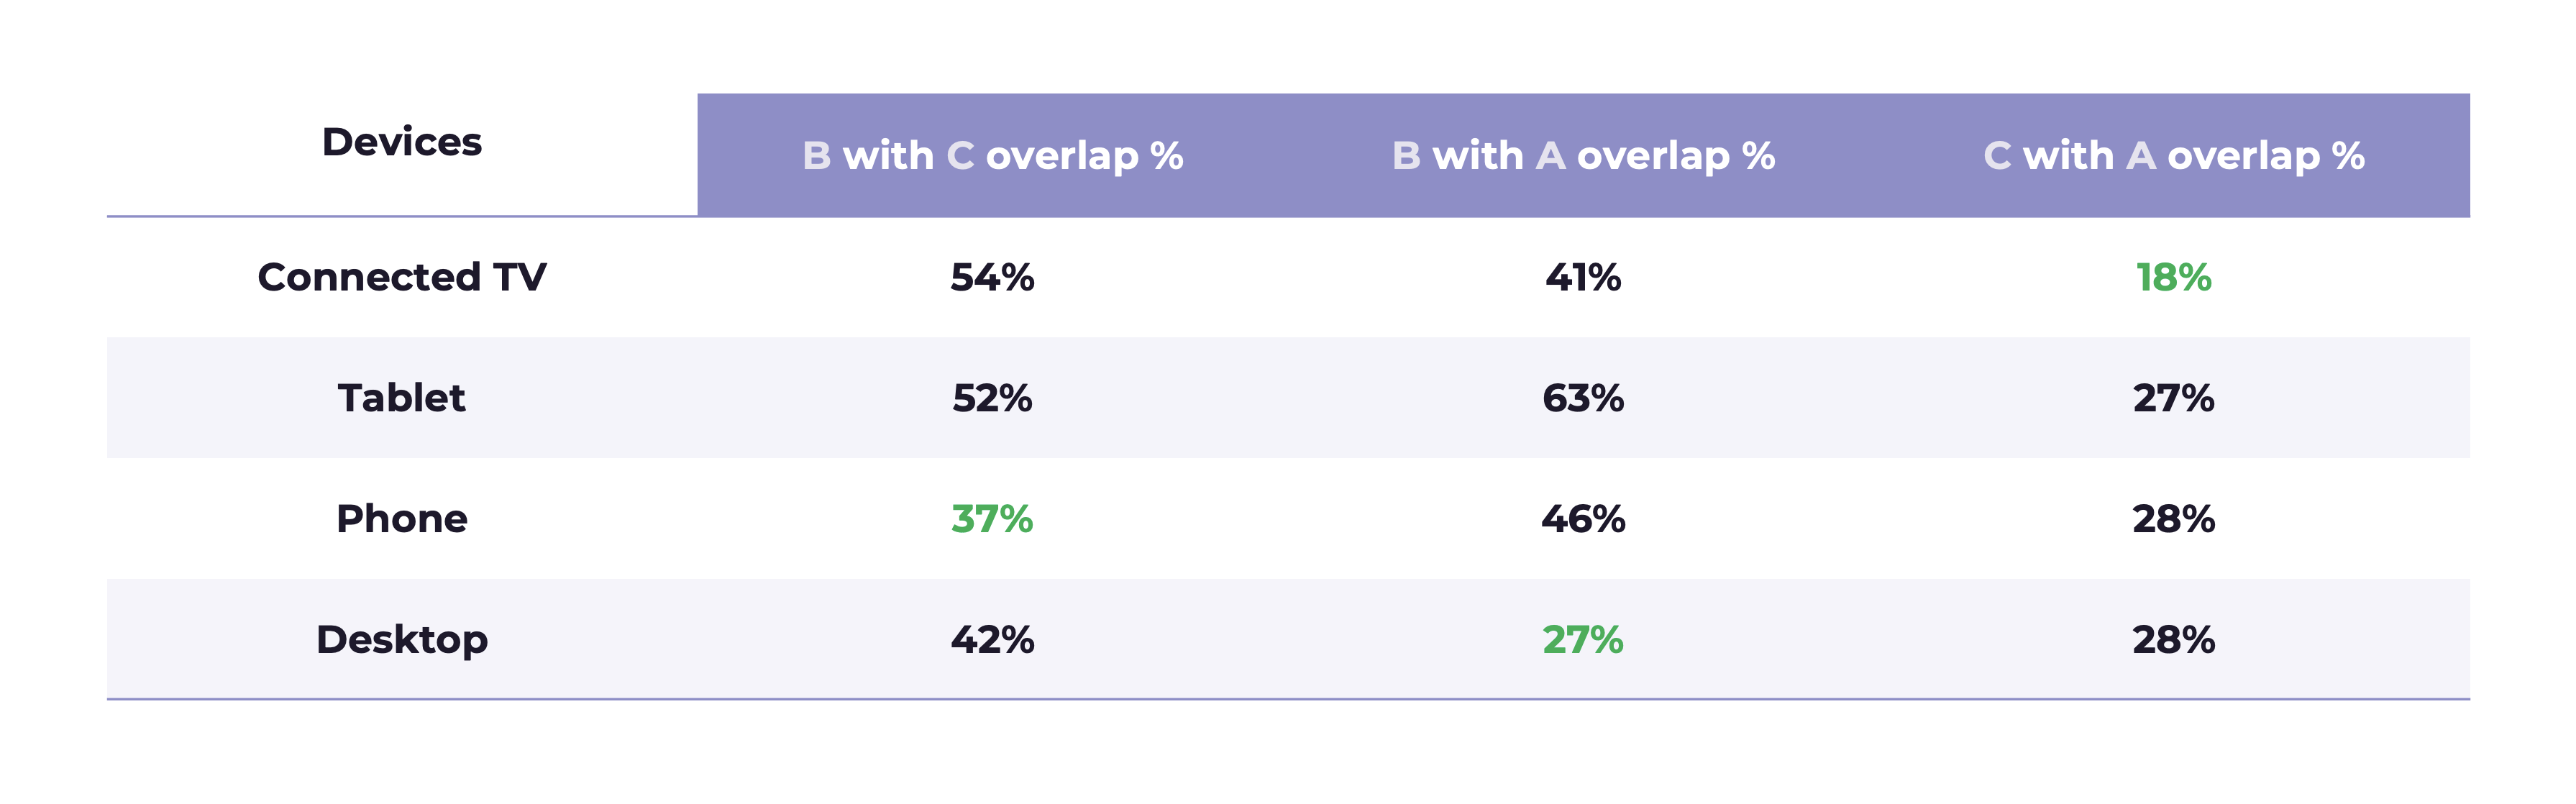
Once here, experienced awareness media buyers will naturally turn their attention to expand the analysis towards the Audience Overlap by Device. This report provides insights into which devices across various publishers can provide Exclusive Reach and which can’t. Armed with this information, advertisers can then minimize overlap in their existing targeting or deals with publishers. Moreover, they can explore new strategies to simultaneously reduce Overlap while scaling Reach.
But as you’re all set to spice up your Unique Reach Overlap report in DV360 by throwing in the “device type” dimension, an unexpected party crasher decides to join the scene.
In the wise and simple words of a Google representative, “Ads Data Hub simply offers more granular views, along with the ability to join your 1P data to Google data.”
That might sound like a low-key statement, but in our opinion, if advertisers fully embraced data clean rooms such as ADH, probably half of the total branding dollars would take a whole new path.
Now, back to the data. As we can see below, with ADH we can break down overlap by device and publisher, giving us a detailed view of the landscape.
For a deeper dive, check out this article if you have ADH and looking for the SQL query that can generate the above table.
The real magic with ADH happens when we blend this data with an advertiser’s own treasure trove. Why? Because the advertiser isn’t just after finding new users here and there; they’re on a quest to discover where the motherlode of uncharted prospects to their products is hiding across different publishers.
ADH steps up to the plate by enabling to cross-reference granular overlap reports with a cherry-picked customer list. Even better, it lets advertisers explore a handpicked prospect list straight from the advertiser’s first-party data library. Exciting stuff, right? Stay tuned for the next and final article where we’ll deep-dive into how ADH can be your secret weapon in uncovering these hidden gems.
Final Thoughts
The recent years have witnessed a positive transformation in digital maturity, particularly in the direct response marketing realm. Just as Instagram democratized quality photography and brand identity, companies such as Google have significantly enhanced advertisers’ understanding and control over lower funnel tactics. However, this positive trend isn’t mirrored in the online brand marketing measurement and media activation space.
While many organizations have fully implemented AdTech/MarTech stacks, seasoned awareness media buyers remain a small fraction of the total media buying professionals. Consequently, knowledge on maximizing these stacks for efficient brand marketing is scarce. The hope is that, over time, the awareness within the media buying community will grow, leading to the widespread adoption of self-serve clean rooms such as Ads Data Hub.